Inland Flood Modeling in Massachusetts
High-resolution inland flood projections support a variety of planning and flood risk assessments including social, natural resources, and built infrastructure.
Click below to see some of what's possible.
Compare to FEMA
Select a Town to Compare the BSC and FEMA Data
For 100-year Flood Event
- Where is flooding expected under a future 100-year flood event?
- How does this compare to FEMA maps?
Roadways
Explore Flood Impacts by Road Type
- What is the extent of future roadway flooding?
- How does that compare to today?
Environmental Justice
See EJ Areas Impacted by Flooding
- Does flooding impact the community equally?
- Of the projected flooding, what proportion of that is expected in EJ neighborhoods?
Building & Assets
Identify Critical Facilities at Risk
- Which critical infrastructure assets are exposed to flooding in the near term versus long term?
BSC Flood Model Compared to FEMA
| BSC | FEMA | |
|---|---|---|
| Uses Massachusetts Precipitation Frequencies | ||
| Digital Statewide Mapping | ||
| Includes Current and Future Time Horizons | ||
| Models Multiple Storm Events |
Roadways
Environmental Justice
Building & Assets
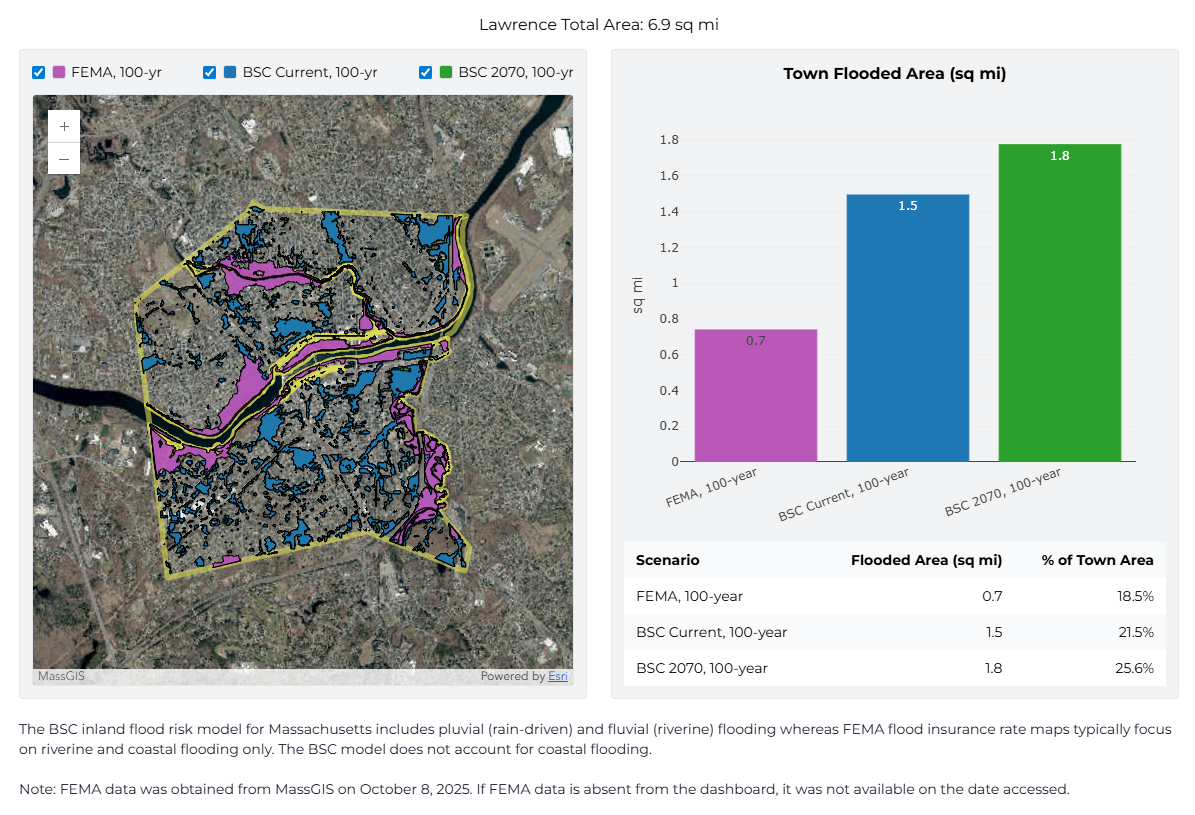
| Scenario | Flooded Area (sq mi) | % of Town Area |
|---|---|---|
| FEMA, 100-year | 0.7 | 18.5% |
| BSC Current, 100-year | 1.5 | 21.5% |
| BSC 2070, 100-year | 1.8 | 25.6% |
Note: FEMA data was obtained from MassGIS on October 8, 2025. If FEMA data is absent from the dashboard, it was not available on the date accessed.
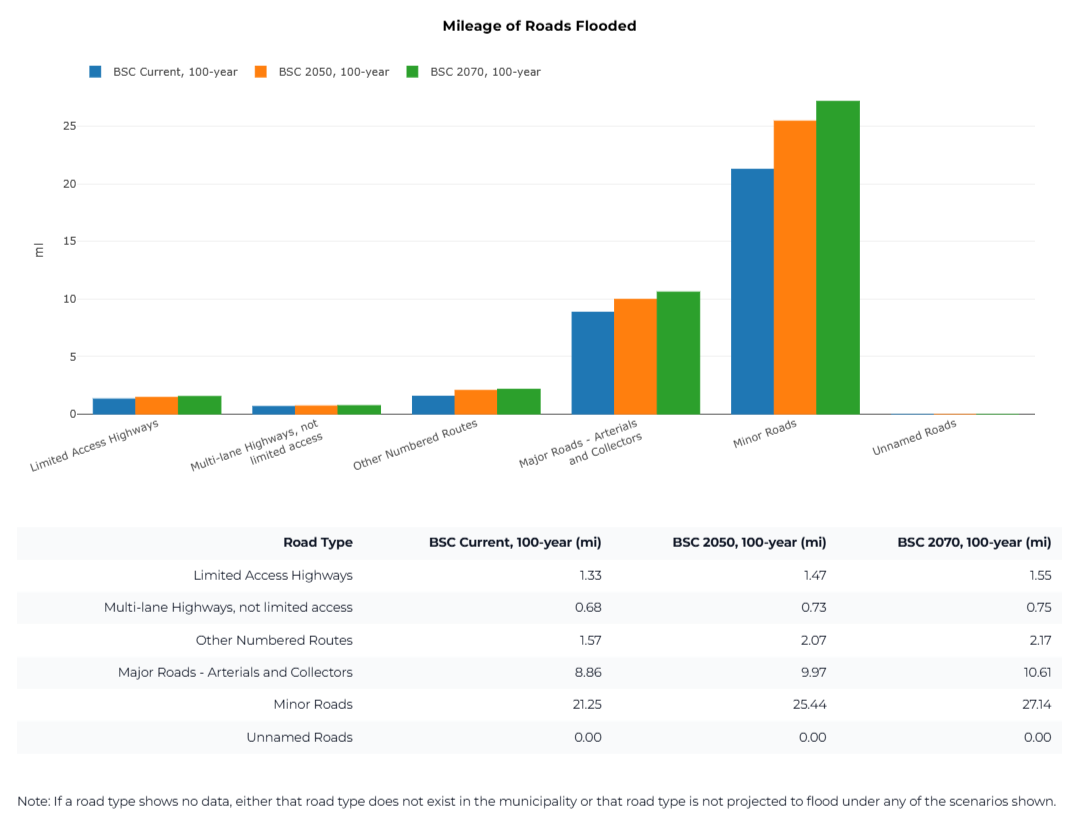
| Road Type | BSC Current, 100-year (mi) | BSC 2050, 100-year (mi) | BSC 2070, 100-year (mi) |
|---|---|---|---|
| Limited Access Highways | 1.33 | 1.47 | 1.55 |
| Multi-lane Highways, not limited access | 0.68 | 0.73 | 0.75 |
| Other Numbered Routes | 1.57 | 2.07 | 2.17 |
| Major Roads - Arterials and Collectors | 8.86 | 9.97 | 10.61 |
| Minor Roads | 21.25 | 25.44 | 27.14 |
| Unnamed Roads | 0.00 | 0.00 | 0.00 |
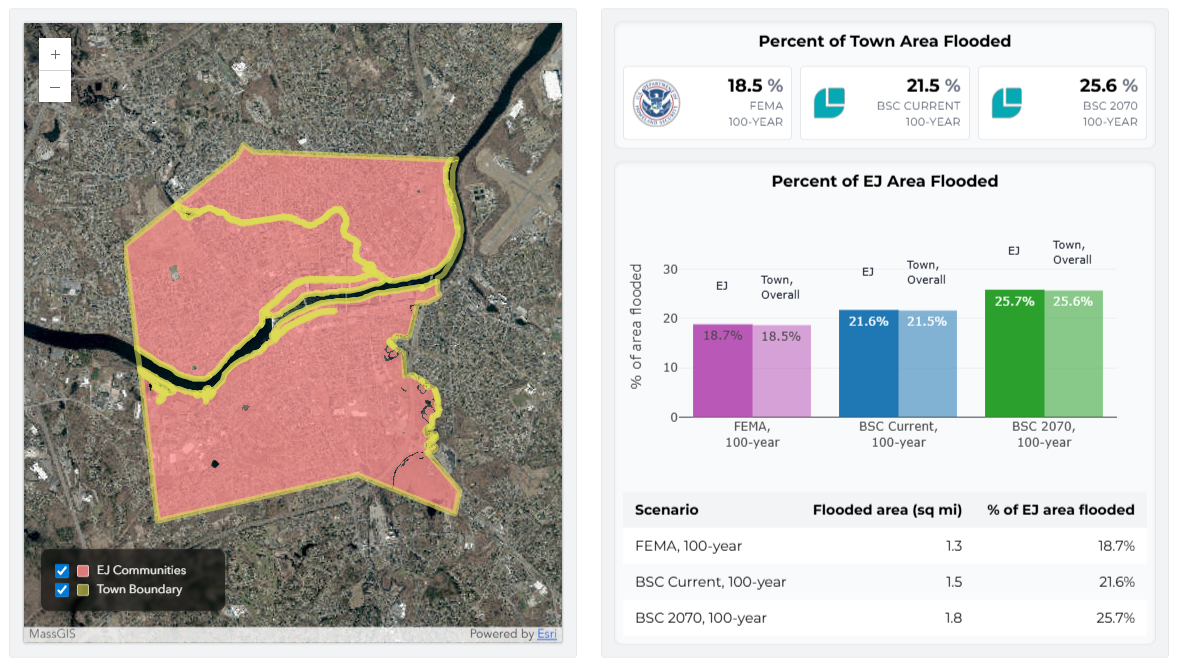
100-year
100-year
100-year
| Scenario | Flooded EJ area | % of EJ area flooded |
|---|---|---|
| FEMA, 100-year | 1.3 sq mi | 18.7% |
| BSC Current, 100-year | 1.5 sq mi | 21.6% |
| BSC 2070, 100-year | 1.8 sq mi | 25.7% |
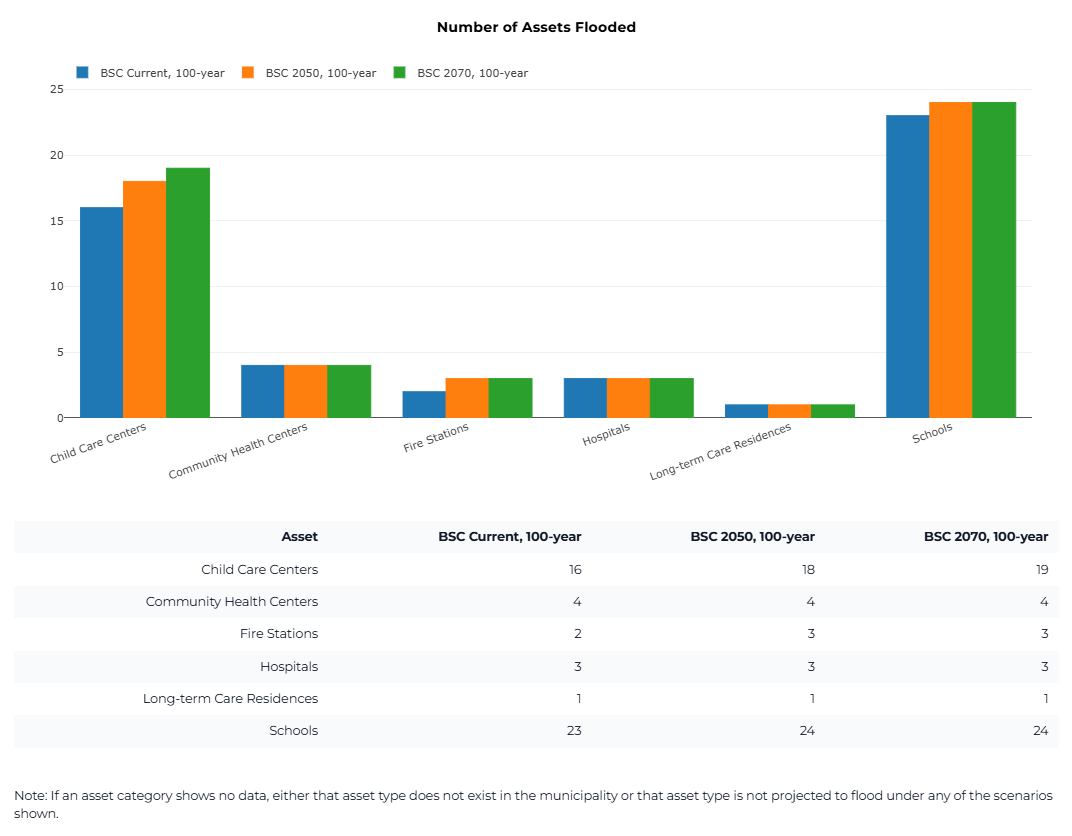
| Asset | BSC Current, 100-year | BSC 2050, 100-year | BSC 2070, 100-year |
|---|---|---|---|
| Child Care Centers | 16 | 18 | 19 |
| Community Health Centers | 4 | 4 | 4 |
| Fire Stations | 2 | 3 | 3 |
| Hospitals | 3 | 3 | 3 |
| Long-term Care Residences | 1 | 1 | 1 |
| Schools | 23 | 24 | 24 |
Contact Us To Discuss Your Needs!
This page provides an illustration of how a community's inland flood exposure changes over time based on projections from BSC Group's inland flood risk model for Massachusetts. The full BSC inland flood risk model for Massachusetts provides statewide flood depths and extents, at a 10 meter resolution, for multiple return periods at the current, 2050, and 2070 time horizons.
More detailed information can be found at: https://www.bscgroup.com/services/flood-risk-information-modeling/